Monitoring
Charmed Kubernetes includes the standard Kubernetes dashboard for monitoring your cluster. However, it is often advisable to have a monitoring solution which will run whether the cluster itself is running or not. It may also be useful to integrate monitoring into existing setups.
Prometheus is the recommended way to monitor your deployment - instructions are provided below. There are also instructions for setting up other monitoring solutions, or connecting to existing monitoring setups.
Monitoring with Prometheus, Grafana, and Telegraf
The recommended way to monitor your cluster is to use a combination of Prometheus, Grafana and Telegraf. These provide a dashboard from which you can monitor both machine-level and cluster-level metrics. See the quickstart guide for more details on installing Charmed Kubernetes.
Installation
You can install Charmed Kubernetes with monitoring using the Juju bundle along with the following overlay file (download it here):
NOTE: Make sure the series is the same as the rest of your kubernetes bundle. Eg: all of series focal.
applications:
  prometheus:
    series: focal
    charm: prometheus2
    constraints: "mem=4G root-disk=16G"
    num_units: 1
  grafana:
    charm: grafana
    expose: true
    num_units: 1
  telegraf:
    charm: telegraf
relations:
  - [prometheus:grafana-source, grafana:grafana-source]
  - [telegraf:prometheus-client, prometheus:target]
  - [kubernetes-control-plane:juju-info, telegraf:juju-info]
  - [kubernetes-control-plane:prometheus, prometheus:manual-jobs]
  - [kubernetes-control-plane:grafana, grafana:dashboards]
  - [prometheus:certificates, easyrsa:client]
  - [kubernetes-worker:juju-info, telegraf:juju-info]
  - [kubernetes-worker:scrape, prometheus:scrape]
  - [etcd:grafana, grafana:dashboards]
  - [etcd:prometheus, prometheus:manual-jobs]
Note:
If you are using Vault instead of EasyRSA you will need to change the
easyrsa:client relation to:
[prometheus:certificates, vault:certificates]
To use this overlay with the Charmed Kubernetes bundle, specify it during deploy like this:
juju deploy charmed-kubernetes --overlay ~/path/monitoring-pgt-overlay.yaml
If you wish to add monitoring to an existing deployment, you can export a bundle of your current environment and then redeploy it on top of itself with the overlay:
juju export-bundle --filename mybundle.yaml
juju deploy ./mybundle.yaml --overlay ~/path/monitoring-pgt-overlay.yaml
Retrieve credentials and login
To open the dashboard in your browser you will need to know the URL and login credentials for Grafana. These can be retrieved with the following command:
juju run grafana/0 get-login-info
This will return the connection and login information, like the following:
unit-grafana-0:
  id: a74acea6-8be9-43c1-8f1c-b1bebe9f5153
  results:
    url: http://10.4.23.162:3000
    username: admin
    password: NYZVkNb3jbMMhWhx
  status: completed
  timing:
    completed: 2019-07-29 22:00:29 +0000 UTC
    enqueued: 2019-07-29 22:00:27 +0000 UTC
    started: 2019-07-29 22:00:28 +0000 UTC
  unit: grafana/0
With that, you can visit the URL and log in using the username and password.
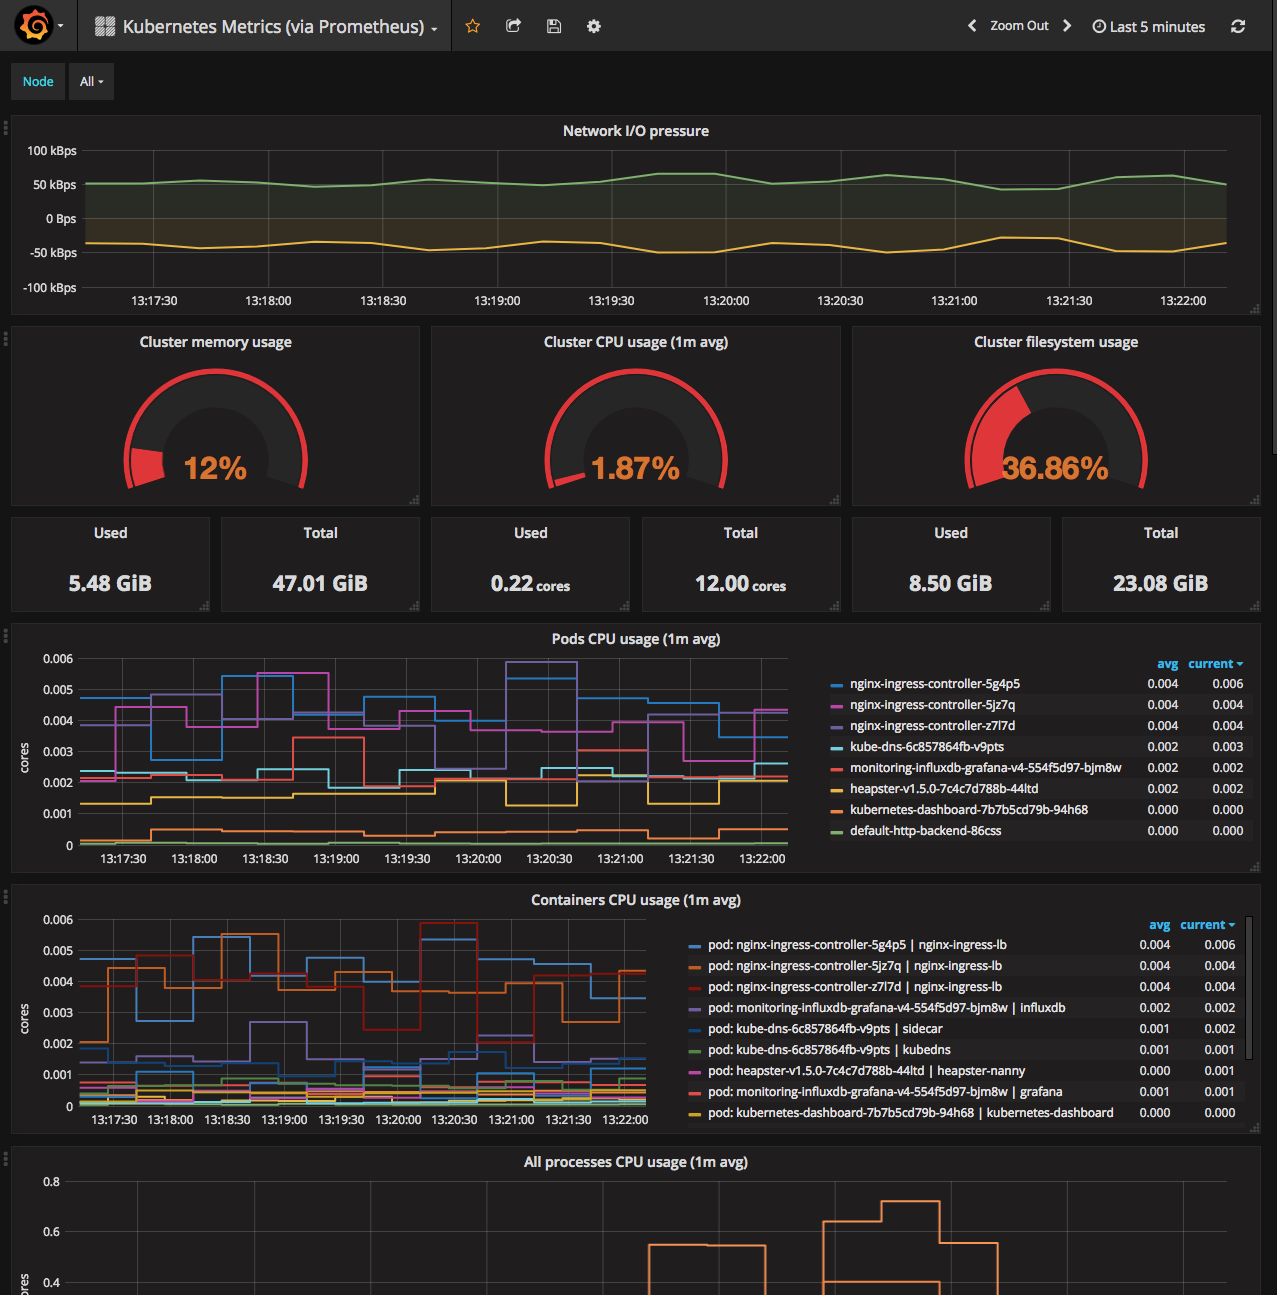
Once logged in, check out the cluster metric dashboard by clicking the
Search dashboards icon and selecting Kubernetes Metrics (via Prometheus)
from the General folder:

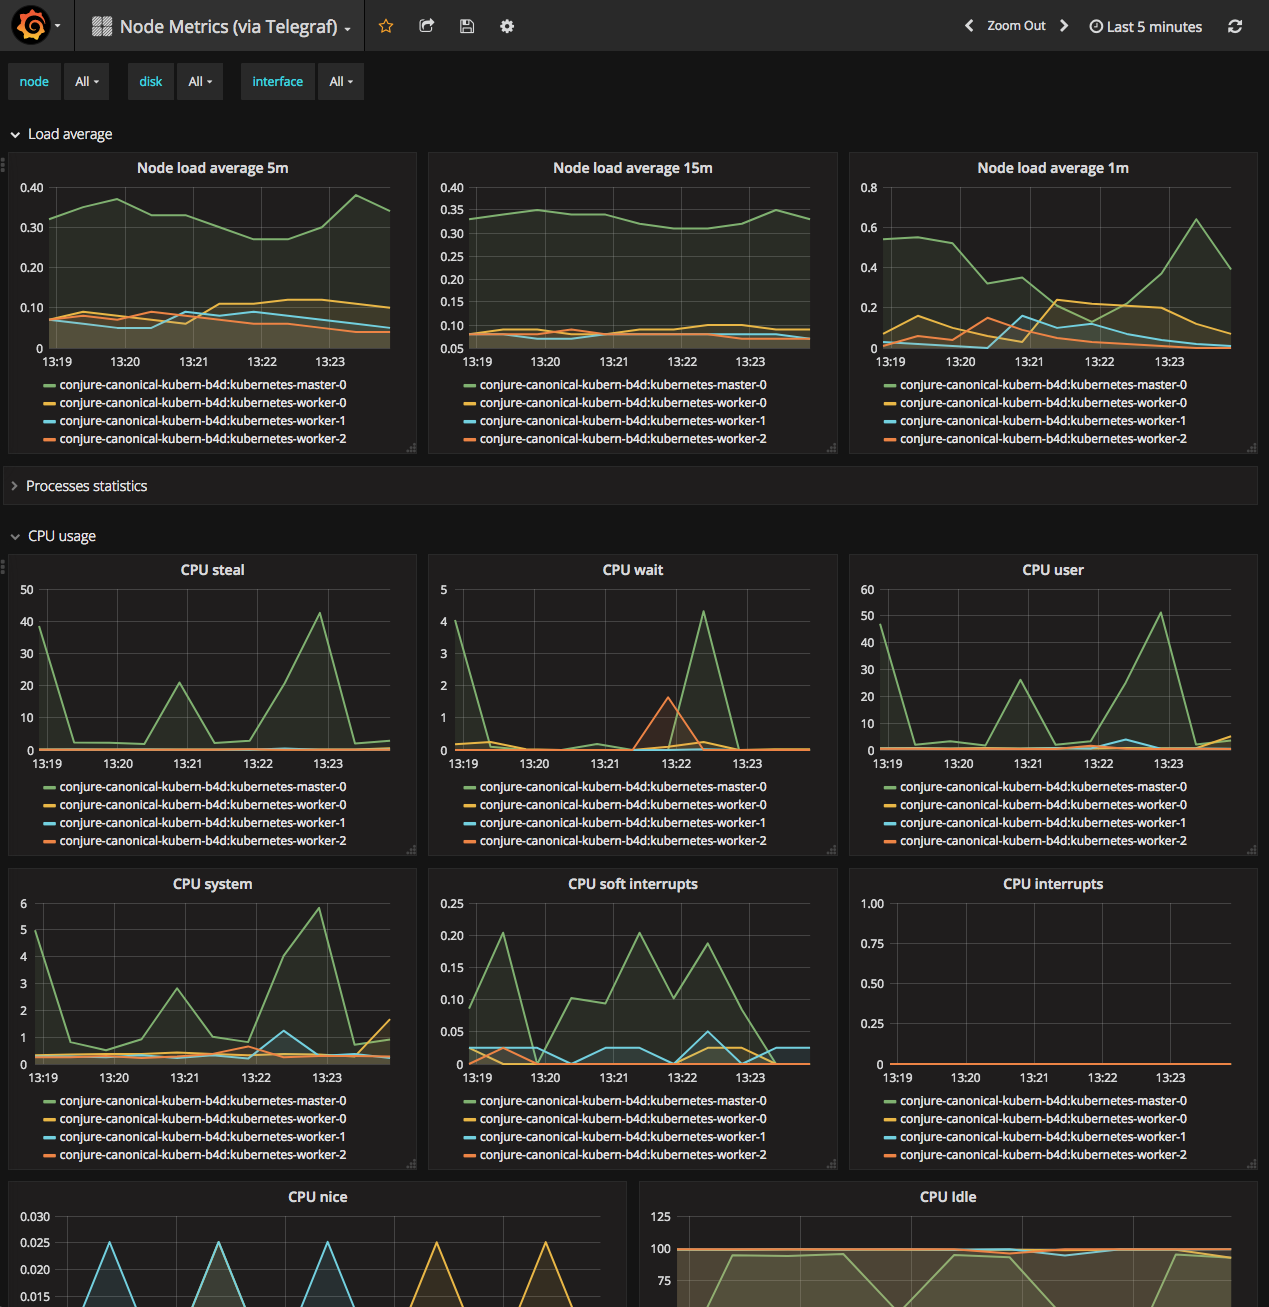
You can also check out the system metrics of the cluster by switching to the
Node Metrics (via Telegraf) dashboard:

Using kube-state-metrics
The kube-state-metrics project is a useful addon for monitoring workloads and their statuses. This involves installing a pod and service into Kubernetes, pointing Prometheus at that endpoint for scraping, and then setting up Grafana to use this data.
Installing kube-state-metrics
Starting with Charmed Kubernetes 1.17,
kube-state-metrics
are added, automatically, when enable-metrics is set to true on the
kubernetes-control-plane charm. This is enabled by default. Enable
with the following command.
juju config kubernetes-control-plane enable-metrics=true
Viewing kube-state-metrics
To view metrics scraped from kube-state-metrics, refer to Monitoring with Prometheus, Grafana, and Telegraf and enable Grafana. You can then open the Charmed Kubernetes Dashboard.
Monitoring with Nagios
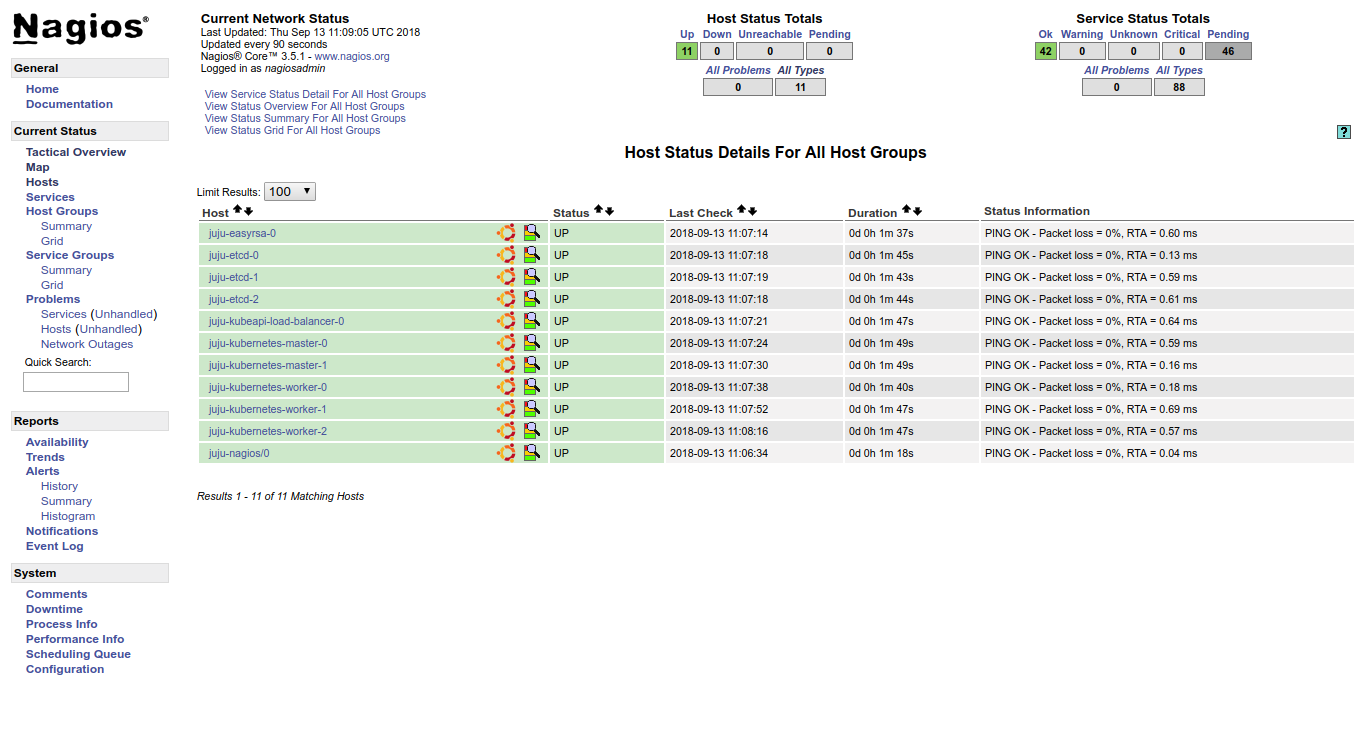
Nagios (https://www.nagios.org/) is widely used for monitoring networks, servers and applications. Using the Nagios Remote Plugin Executor (NRPE) on each node, it can monitor your cluster with machine-level detail.
To start, deploy the latest version of the Nagios and NRPE Juju charms:
juju deploy nagios --series=bionic
juju deploy nrpe --series=bionic
juju expose nagios
Connect Nagios to NRPE:
juju integrate nagios nrpe
Now add relations to NRPE for all the applications you wish to monitor, for example kubernetes-control-plane, kubernetes-worker, etcd, easyrsa, and kubeapi-load-balancer.
juju integrate nrpe kubernetes-control-plane
juju integrate nrpe kubernetes-worker
juju integrate nrpe etcd
juju integrate nrpe easyrsa
juju integrate nrpe kubeapi-load-balancer
To connect to the Nagios server, you will need its IP address:
juju status --format yaml nagios/0 | grep public-address
The default username is nagiosadmin. The password is randomly generated at
install time, and can be retrieved by running:
juju ssh nagios/0 sudo cat /var/lib/juju/nagios.passwd

Using an existing Nagios service
If you already have an existing Nagios installation, the nrpe charm can
be configured to work with it.
juju config nrpe export_nagios_definitions=true
juju config nrpe nagios_master=<ip-address-of-nagios>
See the External Nagios section of the NRPE charm readme for more information.
See the guide to contributing or discuss these docs in our public Mattermost channel.
